|
NUMBER 20
|
WINDSOR STATION - MONTREAL
|
SEPTEMBER 1st, 1937
|
Records Locomotive Efficiency
Assistant Engineer, Office of Chief of Motive Power and Rolling Stock.

When about to start on the job of creating a new locomotive, the man or group of men responsible for its creation must have clearly in their minds exactly what they want of the new engine to do, how many tons it will pull under certain conditions at given speeds, and what will be its operating cost in fuel and the other necessities that give it life.
All that being decided, the locomotive is designed on the drawing boards of engineers, its various parts are built, and one fine day it rolls out of the shops under its own power, a living, moving unit ready to take up its share of the country's transportation work. Then comes the question just what will it do, and how will it do it, and here is where the dynamometer car comes in to supply the perfect answer. Attached to a moving locomotive, its intricate and delicate machinery turns out a series of records of exactly what the engine will do and thus enables that engine to be utilized to the highest possible point of efficiency and thus justify the investment it represents.
From charts made by its mechanism under service conditions, adequate and economical tonnage ratings through the entire range of speed variations are determined, and effects of grades and curves, fuel and water consumption requirements, and of train timing and schedules made apparent.
The Canadian Pacific Railway has had many years of experience in the use of such cars, several of which have been designed, built, and operated by the Company. As the increasing sizes of locomotives and heavier freight trains changed operating conditions, the cars were equipped to cope with greater loads and faster speeds.

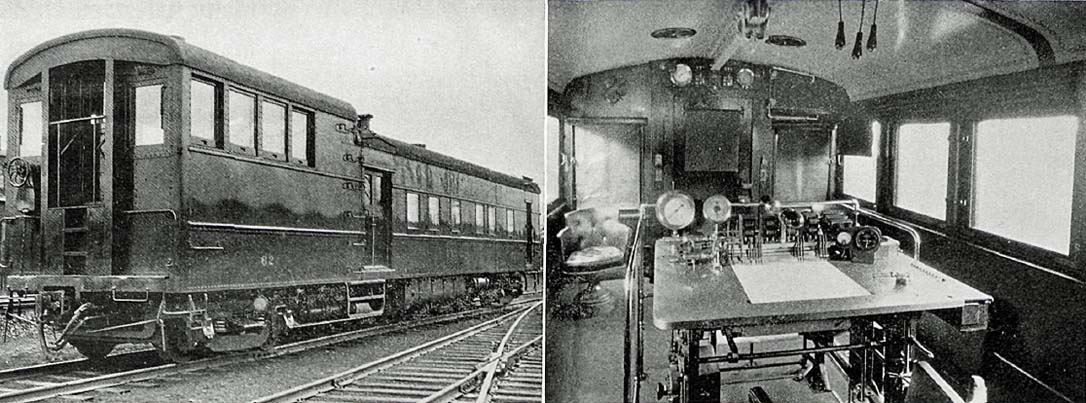
Dynamometer Car
The present car was designed in 1928, was built at Angus Shops, and has become a familiar sight at many division points. It has been an accurate, reliable instrument, is easy to operate and maintain, and embodies many special features not found in the cars of other railroads.
Since the haulage capacity of locomotives interests operating officers in relation to tonnage rating, it is thought that before discussing the methods used in calculating such ratings, a description of the car and machinery by which the records are made may be in order.
The Canadian Pacific dynamometer car is of steel construction, 60 feet long, supported upon a steel underframe of unusually rugged design. It is carried upon two four wheeled trucks, having cast steel truck frames, and weighs 145,000 pounds when ready for service.
A recording mechanism at the front end of the car consists of a hydraulic weighing head, located under the cupola floor, an electric drive and transmission, also located under the cupola, a mechanical paper and speedometer drive, geared to the rear axle of the front truck, and a chronograph table located in the cupola, upon which a chart is made continuously while the car is in motion.
Serving the purpose of a hydraulic scale the weighing head has a pulling capacity of 500,000 pounds, and a buffing capacity of 1,250,000 pounds.
The principle of operation is as follows: A special coupler connects directly, without the introduction of draft springs, to the lower end of a vertical lever, extending upward into the weighing head casting. This lever, fulcrumed at an intermediate point, transmits any movement of the coupler to a piston, mounted upon ball bearings, in the cylinder of the machine. The pressure of this piston upon a leather diaphragm, builds up hydraulic pressure in a liquid contained in a chamber between the diaphragm and the cylinder head, in exact proportion to the pull exerted on the coupler. Conveyed through piping to a recording cylinder located upon the chronograph table, the liquid forces a piston to move outward. The crosshead at the end of this piston is connected to a pen carrying lever, which moves upon the paper of the recording chart, in proportion to the pressure exerted. By measurement of the distance from the datum line on the chart to the line traced by the pen point, the draw-bar pull in pounds may be determined. As the chart moves across the table the result is a continuous draw-bar pull curve. Buffing loads are similarly handled, but are not recorded.
Chart Drive and Transmission
The electric drive for the chronograph chart consists of a 3/4 H.P. motor taking current from the car batteries. It is designed to give selective speeds for the paper roll of 3 3/8 inches, 16 inches, or 60 inches per minute and is used when car is not in motion. The motor is automatically governed to maintain a constant speed of 1,800 revolutions a minute, and also drives a portion of the speedometer gear. An automatic electric contractor records every six seconds time interval.
A mechanical paper drive is geared to the truck axle and gives selective speeds for the paper roll of 1/16 inch, 1/4 inch, and 1 inch movement per 100 feet of car travel. The wheels of the driving axle are of special design and are maintained at a fixed diameter so that variations in paper travel are minimized. Mechanical drive is used at all times when the car is in motion. The axle drive mechanism also operates an automatic electric contractor recording each 100 feet that the car travels.
Electrically Recorded Data
The chronograph table is located in the elevated instrument room or cupola at the front end of the car. The location of the cupola floor above the weighing head and the transmission permits freedom of movement around the chronograph table, protects the weighing head and transmission from damage and allows the operator more readily to observe test operations.
The chronograph table provides for registration of the following data upon the chart:
2 - Six second intervals.
1 - One minute interval.
1 - Mile post location.
1 - 100 foot interval.
1 - Speed curve.
1 - Draw-bar pull curve.
1 - Draw-bar horsepower Integrator.
1 - Brake cylinder pressure.
1 - Brake train line pressure.
The speedometer mechanism, integrating mechanism, pull cylinder recorder and all electric relays used for pen operation are conveniently located upon the table. All levers for regulating paper speeds, and motor speeds are conveniently located.
A laryngaphone installation furnishes telephonic communication between the chronograph operator and an observer upon the locomotive. By this means such data as boiler pressures, throttle and reverse lever positions, and other test information is given to the operator and written on the chart, at the correct time and location to depict completely the performance of the locomotive.
Accommodations in the dynamometer car have been especially arranged to suit Canadian climatic conditions and to further convenient operation in service. The cupola or instrument room is 14 feet 6 inches long, with floor 3 feet 0 inches higher than the rear portion of car. Descending four steps, a hall or work room is reached. Next comes a lavatory room with necessary washbowls, dental bowl, shower bath, toilet, and cupboard facilities. The crew space consists of a bedroom, a dining room with seating space for eight, a steward's room, and a well equipped kitchen. This car is in effect a complete testing unit, which can be kept in service over long periods at a minimum of inconvenience and expense.
Tonnage Rating
Establishment of correct tonnage ratings is absolutely essential if all locomotives are to be properly loaded and traffic moved expeditiously and economically. The procedure followed in setting a tonnage rating involves a number of factors not only in connection with the engine, but also relative to train resistances due to grades, curves, and rolling friction.
On the Canadian Pacific the system of rating used is known as the "Equivalent Tonnage" method, by which, in addition to ascertaining the loading due to the actual weight of train and contents, allowance is made for trains consisting of combinations of light and loaded cars.
For this purpose it is assumed that the train which offers the least resistance is that in which the weight of contents is twice that of the tare weight of the cars. By adding to the actual weight of a train consisting of empty or not fully loaded cars an allowance sufficient to equalize the equivalent tonnage to correspond to that of fully loaded trains, uniformity of locomotive performance is attained. This allowance is varied to suit the percentages of grades encountered and is known as the "chart basis" being divided into three percentages as follows:
For grades 0.5% and less - 30% chart
For grades 0.5% to 1.25% - 20% chart
For grades 1.25% and over - 10% chart
The application of this "chart" allowance in calculating tonnage will be explained later.
Study Division Profiles
Assuming, for example, that it is desired to set the correct tonnage rating for a class P2f (a 2-8-2 Mikado) locomotive, operating on a specific subdivision, at a speed of 10 m.p.h. on ruling grade, the first step taken would be a study of the condensed profile of this subdivision, which is supplied by the Chief Engineer's office, and which portrays gradients and curvatures in detail. Copies of these profiles are carried in the dynamometer car for each subdivision. From this would be determined the ruling grade on the portion of railway under consideration, say 1%, with a six degree curve on the grade.
The next step would be to determine how much draw-bar pull, available for handling the train, would remain after resistances to movement of the locomotive had been overcome, as follows:
Tractive effort, class P2f engine, 57,300 pounds; machinery friction at 25 pounds per ton weight on drivers, 3,060 pounds; grade resistance, engine and tender at 20 pounds per. ton for each % grade, weight of tender assumed at 2/3 loaded, 5,222 pounds; curve resistance engine at 1.5 pounds per ton, weight on drivers per degree, 1,100 pounds, curve resistance tender at 0.8 pounds per ton weight per degree, 446 pounds; rolling friction, engine trucks and tender, 138.7 tons at 2.5 pounds per ton, 348 pounds; the whole giving a total resistance of 10,176 pounds, which translates the available draw-bar pull into 57,300 minus 10,176 equals 47,124 pounds.
Assuming the average weight of each car in the train to be 50 tons, the train resistance and tonnage rating would be calculated as follows:
Grade resistance per ton, 20.0 pounds; curve resistance per ton, 6 degrees x 0 8, 4.8 pounds; rolling friction per ton, 4.1 pounds; total resistance per ton,
28.9 pounds.
Therefore, tonnage the engine could handle over this grade would be 47,124 divided by 28.9, 1,630 tons.
Application of the "chart" basis to derive "equivalent tons" is illustrated by the following typical example: Train consist 34 cars, contents 940 tons, tare 653 tons, actual gross tons, 1,593.
The method of application is as follows:
Contents, 940 tons, tare, 653. One half of the contents, 470 tons, is subtracted from the tare, leaving the figure 183 tons. This, multiplied by the .20% chart allowance for one percent grade has a resulting figure of 36.6 which is accepted as 37 tons. The resulting equivalent tonnage therefore is: Contents, 940, tare, 653, resistance, 37, total, 1,630 equivalent tons.
Local Considerations Govern
While setting tonnage ratings there are frequently local considerations, such as velocity grades, slow orders through towns and over bridges which may affect favorably or unfavorably the tonnage which may be handled. By study of the dynamometer charts allowances can be definitely made to meet these conditions.
The most desirable foundation for tonnage movement is maximum "gross ton miles per train hour" which can be economically handled.
Either overloading of locomotives or under rating of tonnage brings about an abnormal fuel consumption in relation to each 1,000 equivalent gross ton miles handled, increases maintenance cost of locomotive, and produces a poor performance record.
Only by knowledge founded on accurate data and a thorough analysis of the traffic operation can the best results be obtained. The dynamometer ear furnishes this information, in such a form that the operating officer has at his hand a complete story of his train movements and can govern his transportation accordingly.
 |
 |
 |
 |
 and is reprinted here with their permission.
All photographs, logos, and trademarks are the property of the Canadian Pacific Railway Company.
and is reprinted here with their permission.
All photographs, logos, and trademarks are the property of the Canadian Pacific Railway Company.