
1 January 2009
Optimizing Winter Speed Restrictions
 To optimize cold-weather speed restrictions,
Canadian Pacific Railway worked with NRC Canada to investigate and recommend an alernate approach.
To optimize cold-weather speed restrictions,
Canadian Pacific Railway worked with NRC Canada to investigate and recommend an alernate approach.
by Yan Liu, Chris Ladubec, Jon Preston-Thomas and Eric Magel, Centre for Surface Transportation Technology, National
Research Council of Canada, and Michael Roney, Canadian Pacific Railway.
| |
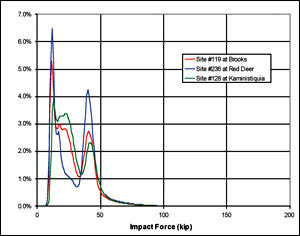
Figure 1: Frequency Distribution of WILD Impact
Measurements-Linear Scale.
|
The experience of the Canadian Pacific Railway is that the probability of breaking a rail increases significantly under conditions of
extreme cold. When the ambient temperature drops below -25 degrees C (-13 degrees F), CPR has a practice of limiting the train speed, with the goal of
reducing impact forces from shelled and out-of-round wheels. Under the current approach, trains are generally slowed down
to 35 mph in site-specific track segments (those that in the recent past have experienced cold weather breaks, have
lighter rail sections, or have support problems that make them more susceptible to cold weather breaks) at temperatures of -25 degrees C and
colder.
| |
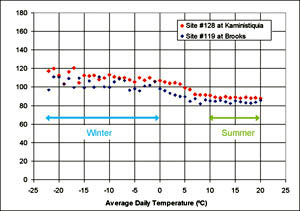
Figure 2: Temperature Dependency of the maximum WILD
readings for each train, winter vs. summer.
|
Then, at temperatures of -35 degrees C (-31 degrees F) and below (-30 degrees C for some subdivisions), train speeds are generally limited to 35 mph in all
track segments in the subdivision. The current policy, while effective, has a substantial impact on average train speed. CPR believes
there are opportunities to better optimize cold-weather speed restriction rules through the application of good science
and contracted with the National Research Council of Canada's Centre for Surface Transportation Technology (NRC-CSTT) to
examine the problem and recommend an alternate approach.
| |
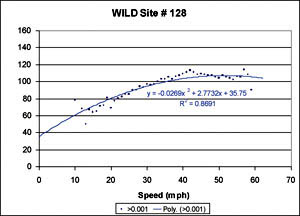
Figure 3: WILD force-speed relationship for
Site #119 with curve fit.
|
NRC-CSTT chose to look at the issue as one of "stress versus strength," following the popular "stress
state of the railway" approach initiated by the AAR. "Stress" refers to the loading that the track components see due
to environmental conditions and railway wheel contacts. These stresses tend to be higher in winter because of the increased severity
and numbers of shelled wheels.
"Strength" refers to the ability of the track and infrastructure to endure forces, withstand damage, and avoid breakage.
Track strength in winter decreases primarily due to reductions in fracture toughness with temperature and due to increased rates of
growth of transverse defects that can eventually lead to broken rails. Most of the time the strength is much higher than the stress
and failures are rare. However, as the stress rises and the strength declines, the gap diminishes and the risk of failure, such as a
broken rail, increases.
| |
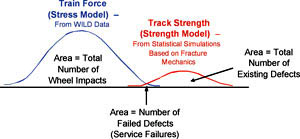
Figure 4: Calibration of Track Strength Model using
Train Force and Track Strength Distributions.
|
The Stress Model
The stress model is based on the analysis of Wheel Impact Load Detector data supplied by CPR. NRC-CSTT received roughly
50 million WILD readings for 75,000 trains from three different WILD sites. These data were used to analyze nine subdivisions.
Figure 1 shows the frequency distribution of WILD impact readings from all available wheel impacts at the three WILD sites. Two
distinct peaks are seen, corresponding to empty (leftmost peak) and loaded trains (rightmost peak). The peak representing the loaded
trains is centered near the static vertical load carried by each wheel (33-36 kips).
| |
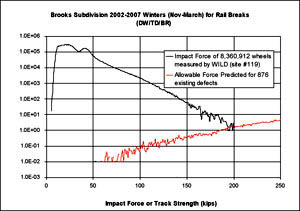
Figure 5: Calibration of Track Strength Model, Brooks
Subdivision.
|
Beyond this, the loads are largely dynamic and arise primarily from wheel tread defects. The focus of this study is mainly concerned
with the extreme right tail of the distribution. If viewed using a logarithmic scale, it is found that an impact force of 100 kips or
more occurs once in every 10,000 wheel readings and that 150 kips or more occurs in approximately one out of every 1,000,000 readings.
Figure 2 shows the 0.1 percent highest impacts binned according to the temperature at which the measurement was made. The red diamond
at -20 degrees C, for example, shows that 0.1 percent of all the WILD readings taken at the Kaministiquia WILD site between -19.5 degrees C and
-20.5 degrees C were at or above 114 kips. Below 0 degrees C (winter) and above 10 degrees C (summer) there is no obvious temperature dependence.
| |
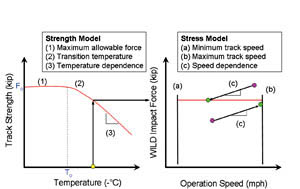
Figure 6: Strength and Stress Models for THAW
Meter.
|
Peak WILD values at various speeds were examined to establish the speed dependence of impact force. Figure 3 shows the
curve-fit to the force-speed relationship for one site, where the force level is taken as the 0.1 percent
value from all trains at that speed. Only small differences were found between the three sites.
The Strength Model
Data from CPR were studied and the type and frequency of detected defects and service failures were utilized to develop an appropriate
strength model.
Defect Data: Five-year service-failure records and defect detection records were made available by CPR
for selected subdivisions in the Alberta and Northern Ontario service areas. A significant number of detected defects are transverse
defects in the railhead. The types of defects/service failures considered in this study are:
- Transverse defect/detailed fracture;
- Transverse fissure/compound fissure;
- Transverse defect under a weld repair;
- Defective field weld;
- Defective plant weld.
Transverse Defects - Fracture Mechanics Approach: The fracture mechanics approach used in modeling transverse defects was
validated through laboratory testing of samples of rails with known internal defects by Igwemezie et al.1 In that study, fracture
resistance testing was used to determine the fracture load of rail by considering such variables as rail defect size, location, rail
size and type, ambient temperature, and track stiffness.
The vertical bending moment due to impact force in the rail is computed by considering the rail as a beam supported on an elastic
foundation. In this exercise, we were concerned with the largest reverse bending moment, since the resulting tensile stress is the one
which will propagate a crack opening (mode I) failure.
The longitudinal thermal stress is calculated using a standard formula that shows tensile stress increasing linearly as the rail
temperature drops below that of the rail neutral (stress-free) temperature.
Residual stress is calculated as a function of the defect size (as percentage of the head area) times a severity factor, as suggested
by Jeong.2 Unfortunately, there is much uncertainty in the severity factor, as this can change considerably from one rail section to
another, and even from one rail sample to another of the same rail section and manufacture. The severity factor was found to range
from 0.1-1.8.
The above three force (stress) components all contribute to the stress intensity (K) associated with an elliptical transverse defect.
(See ref. 2 for details.) The rail section containing a transverse defect will break when the applied stress intensity factor becomes
larger or equal to the mode I fracture toughness of the rail steel, KIC. The fracture toughness of the rail steel is generally
temperature dependent.
The maximum allowable impact load is defined as that which KI = KIC (for a specific temperature and residual stress level). It can be
considered to be the remaining strength after the thermal and residual stress contributions have been subtracted. Solving for the
impact force to cause fracture of a transverse defect from equation of KI = KIC gives
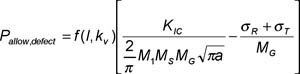
where f(I, kv) is a function of the moment of inertia (I) of the rail section and the track vertical stiffness (kv).
- a represents the semi-major axis length of the assumed elliptical defect;
- M1 is a factor to account for the finite dimensions of the rail;
- MS is a factor to account for the defect not having a circular shape;
- MG is a factor to account for stress gradients in the head of the rail;
- SigmaR is the residual stress;
- SigmaT is the thermal stress;
- KIC is the fracture toughness (from tensile testing).
In the present study, a random number generator was then used to select values for various parameters from realistic distributions
used in the above track strength equation. This numerical procedure generates a stochastic distribution of allowable impact force for
all existing defects. After calibration using the defect and service records, the strength distribution obtained is used to establish
allowable impact force vs. temperature relationship for each subdivision.
Calibration of the Strength Model
With much uncertainty in many of the parameters used in the Strength Model, the model inputs were calibrated to match existing defect
data provided by CPR. The calibration approach is illustrated in Figure 4. On the left is a representation of the distribution of
train impacts (train force). On the right is the distribution of allowable impact forces determined by the statistical evaluation of
track strength. The overlapping region between these two distributions should correspond to the number of failures. The poorly known
residual stress value range was adjusted so that the area of the modeled overlap region equalled the total number of service failures
reported over the past five years. An example is shown in Figure 5 for one subdivision. This calibration procedure was repeated for
each subdivision.
The THAW Meter
The Stress versus Strength Model developed by NRC-CSTT has been incorporated into an Excel-based tool for
CPR called the "THAW" Meter. Trains Highball All Winter refers to the desired state of eliminating all cold
weather-related slow orders. The THAW meter provides the maximum recommended speed for an individual train in cold
weather, based on:
- the subdivision (with its defect history, rail size distribution, and target neutral temperature);
- ambient temperature;
- train wheel condition as measured by WILD values.
Figure 6 illustrates the stress/strength concept on which the THAW Meter is based. The strength aspect of the track is illustrated in
the left of Figure 6. The allowable impact force takes the maximum value (Fo) at higher temperatures, becomes temperature dependent as
the temperature decreases beyond the transition temperature (To), and decreases thereafter with an approximately constant rate as
temperature decreases.
The transition temperature is suggested to be constant across all subdivisions, and a value of -25 degrees C has been chosen to coincide with
CPR's experience. Differences in the subdivisions are accounted for with the Transition Force (Fo), which for the nine subdivisions
included in this study varies from 110-140 kips. The temperature dependence (rate) is obtained from the strength model
calibration described in Section 3.
The stress aspect is illustrated in the right hand side of Figure 6. The minimum speed (a) is provided by CPR and the maximum speed
(b) comes from the railroad timetable. The speed dependence (c) of the impact force is established by WILD data analysis in Section 1.
The Strength Model at a given temperature sets the maximum allowable impact force (horizontal red line). If a train has a WILD reading
that exceeds the maximum allowable impact force it can be slowed down so that the wheel impact forces are all below the threshold. On
the other hand, if a train has WILD readings that are all below the maximum allowable impact force, the train speed can be increased
until either the maximum allowable impact force or the maximum allowable track speed is reached.
THAW's Effect on Train Speeds
Using the speed dependence of applied impact force for three WILD sites, the temperature dependence of track strength, To = -25 degrees C and
the subdivision specific Fo values, optimized train speeds were calculated. The optimized train speeds were then compared with the
speeds at the time of the WILD readings and the previous blanket cold slow orders.
The maximum WILD readings from each train, along with the train speed and temperature were extracted from the CPR data. Only readings
with temperatures below -25 degrees C were considered, resulting in nearly 840 trains worth of data for the three sites. The maximum WILD
measurement, train speed, and temperature for each train were input into the THAW Meter to compute the maximum THAW speed. The result
was that two-thirds of the trains were "low-stress" relative to the low temperature track strength
and need not have been speed restricted while the remaining one third had at least one high stress wheel and would have to be slowed
down even further from the current CPR practice.
Conclusions
The THAW (Trains Highball All Winter) Meter is a software tool developed by the NRC-CSTT for the CPR to help optimize
trains speeds in cold weather. It treats the problem of low temperature broken rails as one of stress versus strength. Stress is that
applied by impacting wheels, while strength is derived from fracture mechanics models of rail failure from transverse defects. The
model is calibrated against WILD data and recorded defects from the past five years.
The algorithm produces a good guideline for subdivision-specific speed restrictions in extreme cold weather on CPR. It
offers the potential for low-stress trains to continue at normal timetable speeds, even as temperatures hit lows in the
-35 degrees C (-31 degrees F) range. At the same time, this approach could decrease the risk of rail break under the extreme cold weather by slowing
down "high-stress" trains. The operational challenge of train-specific cold weather speed
restrictions is the effect that train speed variability has on operational fluidity. Further work at CPR will concentrate on the
process for identifying inbound trains with cars having high impacts to ensure that outbound trains can traverse the territory at
higher speeds and lower risk even as the thermometer plunges.
References
1. Igwemezie, J.O., Kennedy, S.L., Feng, X., Cai, Z., "Defective Rail Fracture Under Residual, Thermal and Dynamic
Stresses," Transport Canada Report No. TP-11570 E, CIGGT Report 92-11, December 1992.
2. Jeong, D.Y., "Correlations between Rail Defect Growth Test Data and Engineering Analyses, Part 2. Field Tests," Volpe
Center Technical Report for the UIC/WEC Joint Research Project on Rail Defect Management, January 2003.
|